PVSyst shadow analysis
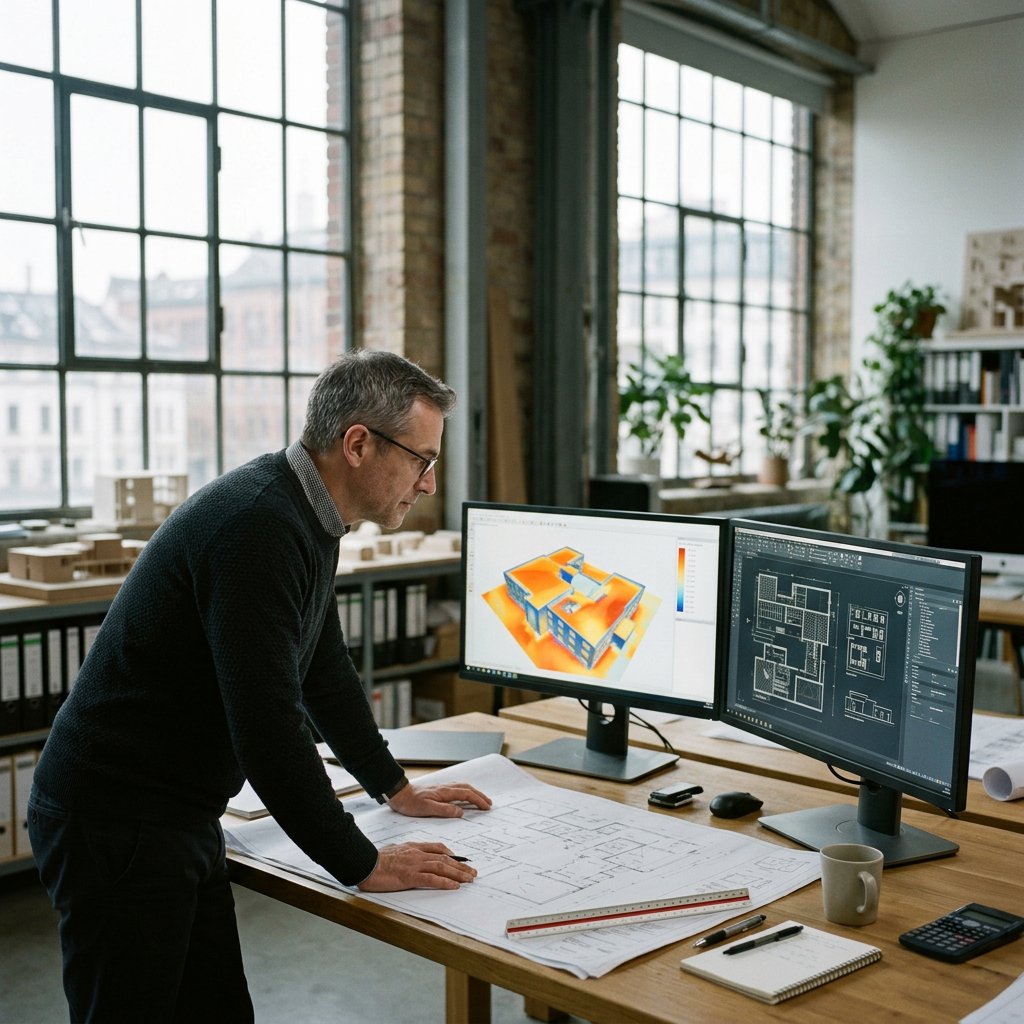
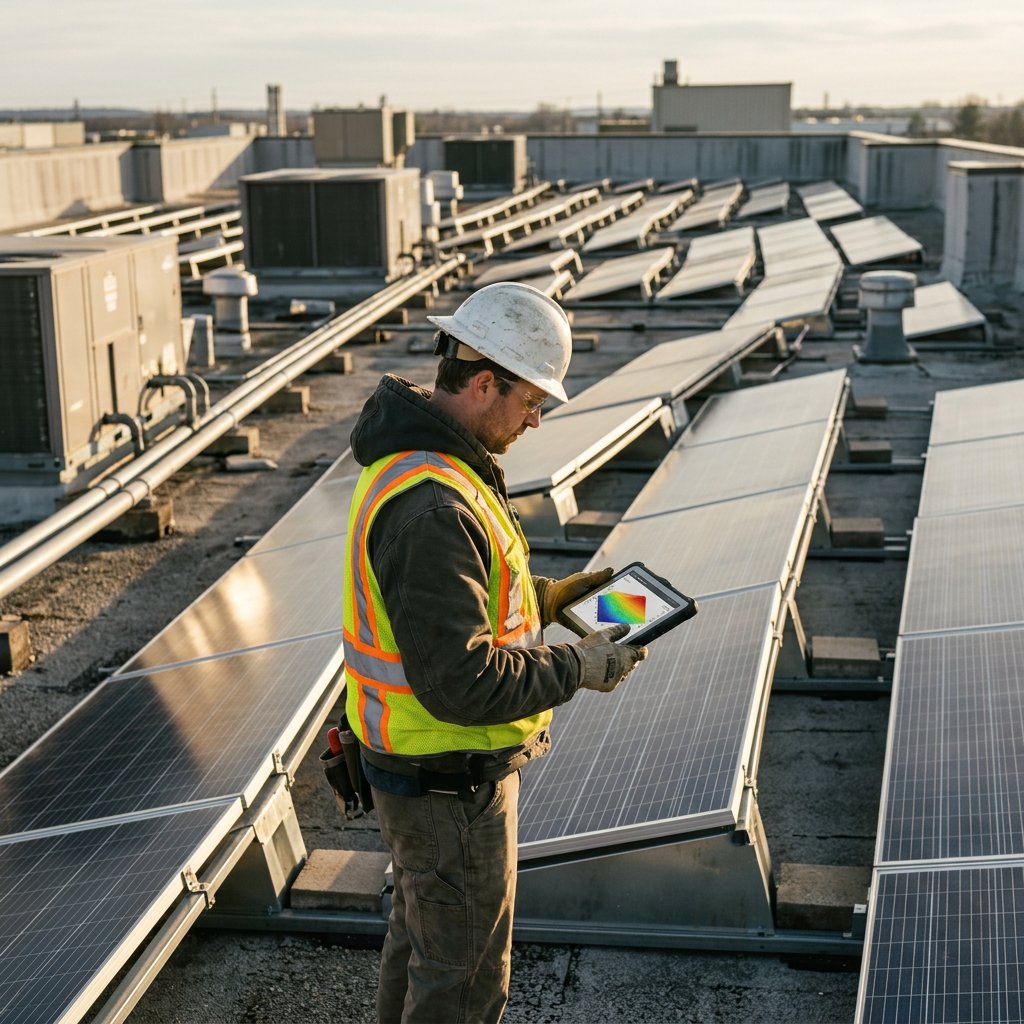
PVSyst shadow analysis is the part of the simulation workflow that combines 3D site geometry, sun position, and PV layout to estimate how shading affects a system over time. That matters because shade is not only a visual problem on a roof or ground mount. It can reduce irradiance, distort string behavior, lower operating power, and make proposal production numbers look stronger than the real site will support.
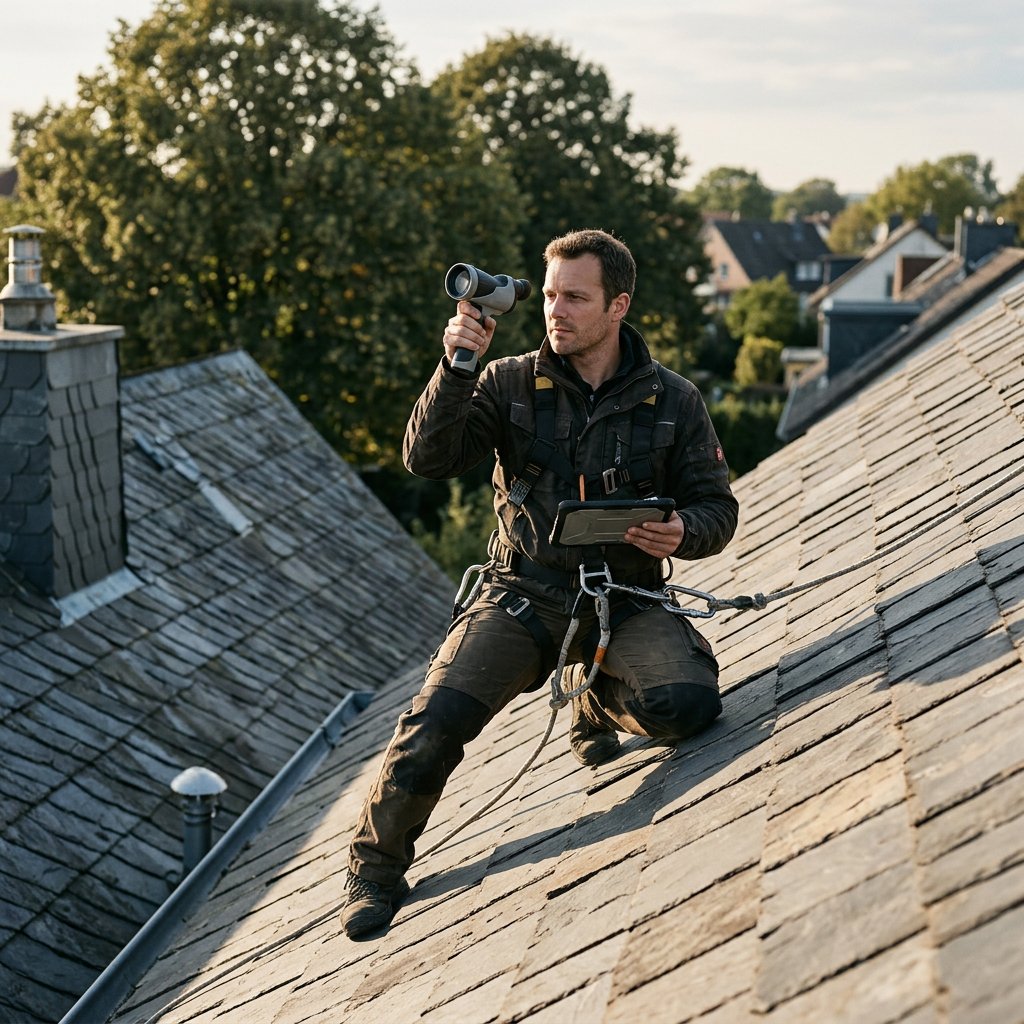
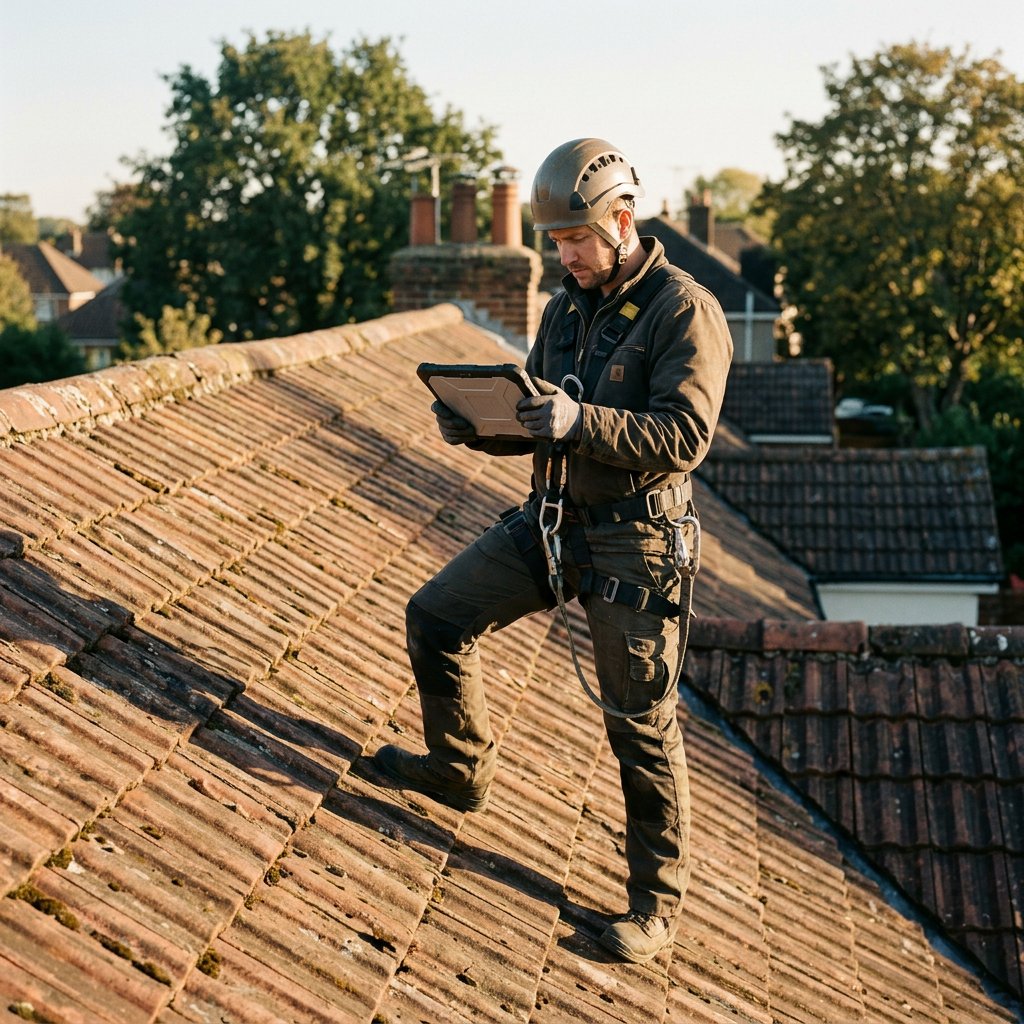
If the shade model is weak, the yield estimate is weak with it. A reliable workflow starts with the right objects in the scene, often informed by shading analysis during site inspections, then uses the scene tools to verify geometry, and finally reads the loss outputs in context before those results influence design choices or sales conversations. If you’re selecting your workflow software, start by choosing the right solar shade analysis tool.
See how shade changes system performance
Shading in PVSyst is time-dependent, not a one-time visual check. A chimney that looks harmless at midday may cast a long winter-morning shadow across active modules, while a nearby tree may matter only during certain seasons or late-afternoon hours. That is why rough static checks often miss the real effect. The impact changes with solar azimuth, solar elevation, array orientation, and the specific geometry between the obstacle and the PV field.
Once part of the array is shaded, the result is more than simple irradiance loss. Partial shading can create mismatch between modules that are trying to operate together under different conditions. That mismatch can pull the operating point away from where unshaded modules would perform best, which reduces effective output. Depending on module layout and protection paths, shaded cells can also face higher thermal stress, increasing hotspot risk if reverse-bias conditions develop before bypass protection takes over.
The electrical effect is especially important on series-connected strings. When current through the string is limited by shaded modules, the I-V and P-V curves change, bypass diodes may activate, and the system can settle at a lower maximum power point. In practical terms, simplified shade assumptions can overstate annual yield and make homeowner-facing production estimates less credible. Good shadow analysis protects both design accuracy and proposal confidence.
Build the 3D site model in PVSyst before you simulate
- Start in the global scene with a consistent reference system so PV fields, roof areas, and obstructions keep the correct relative position, orientation, and scale. In PVSyst shadow analysis, small coordinate mistakes can turn into large yield errors.
- Choose object types deliberately: use PV fields for the active array, basic 2D or 3D shapes for simple obstacles, composed building objects for more structured architecture, and ground elements for terrain or surface context.
- Account for solar geometry while placing everything. Array azimuth and tilt interact with changing sun azimuth, sun elevation, and incidence angle, which directly affects shadow length, strike angle, and spacing decisions.
- When repeated site features appear across the scene, reuse composed objects instead of rebuilding them each time. That keeps dimensions consistent and makes later edits faster and less error-prone.
Validate geometry with the scene tools, not guesswork
- Use single-object selection for precise edits, then switch to multi-select when several obstacles or PV elements need to move together. In denser scenes, box selection is useful for grabbing grouped objects quickly, while lasso selection helps isolate irregular clusters without selecting unrelated geometry.
- Move through the model from more than one angle. Pan and rotate reveal hidden overlaps, preset viewpoints speed up routine checks, and sun-based views are helpful when you want to inspect the geometry from the direction that creates the shade. Zooming in is often the fastest way to catch small edge conflicts that look acceptable from far away.
- Measure instead of estimating by eye. Distance tools help confirm setbacks, row spacing, and clearances from parapets or rooftop equipment. Angle measurements help verify orientation and alignment, especially where a roof plane, an obstacle face, and an array edge must work together in a tight footprint.
- Treat clean-up as part of modeling. Basic move and rotate actions are usually enough to correct misplacements once you spot them, and undo or redo makes it practical to refine the scene without rebuilding objects. That discipline matters because a simulation can look polished while still being wrong if the geometry was never validated.
Choose view settings that expose shade issues fast
| View setting | Best use | What to watch |
|---|---|---|
| Technical view | Best for object edges, snapping, and accurate clicking while building or correcting the scene. | Less intuitive visually, so it may hide how the site feels in a real-world presentation. |
| Realistic view | Better for intuitive shaded visualization and quick communication of obstruction impact. | Can be less efficient for precise editing in busy geometry. |
| Orthogonal projection | Useful for construction, alignment, and dimension checks because scale is visually stable. | Looks less natural than a camera-like view. |
| Perspective projection | Helpful for realistic viewing, reporting, and explaining shade to non-technical stakeholders. | Depth can make spacing harder to judge during scene setup. |
| Display options | Anti-aliasing improves edge clarity, real-time shadows speed inspection, backfaces help visibility, camera animation supports walkthroughs, and string overlays verify the displayed layout. | Higher realism settings can slow performance in complex scenes. |
Read the loss outputs before they skew the proposal
PVSyst does not evaluate shading as a single image. It combines the site geometry with the sun position throughout the year to calculate shading factors over time. That means the result should be read as a pattern of loss by season, hour, and array condition before you calculate solar access and TSRF, not as proof that one screenshot tells the whole story. A short winter obstruction can be more significant than a larger object that affects the array only during low-value production hours.
The next step is to connect geometric shade to electrical behavior. If one portion of a string is shaded, the issue is not limited to the blocked area alone. Current may be limited across the series path, bypass diodes may conduct for affected cell groups, and the operating point can shift to a lower-power condition. This is why visually modest shade can produce a disproportionately large energy penalty, especially when the array layout leaves little flexibility in string behavior.
For decision-making, focus on the outputs that show how much shade changes performance, not just where shadows fall. Shading factors show when and how strongly the geometry is affecting the PV field. The loss breakdown helps indicate how much of the yield reduction is linked to near-shading effects. Performance ratio and long-term yield outputs help translate that behavior into the numbers that matter for design screening and for using 3D solar simulations in proposals.
If the losses look unexpectedly high or inconsistent with the site, do not accept the simulation at face value. Re-check the model assumptions first: obstacle height, object position, array spacing, tilt, azimuth, and whether the intended module layout matches the simulated one. In many cases, a surprising result is a signal that geometry or layout needs refinement before the production estimate is used in a customer conversation.
Use the findings in site surveys and solar proposals
Shadow analysis is most useful when it supports a decision. When planning measurements, teams can apply sun and shadow analysis for site surveys to quantify obstructions and horizon profiles. If nearby buildings, trees, or roof features create avoidable losses, compare layout options, row spacing, or orientation choices instead of defaulting to one arrangement. That turns the model into a design tool within a solar feasibility study for sales rather than a reporting step after the design is already fixed.
It also improves the quality of feasibility reviews and homeowner-facing proposals because production assumptions are tied to a modeled site condition, not a generic shade allowance. Visuals and side-by-side scenarios can make constraints easier to explain during remote assessments or proposal discussions. When the result is highly sensitive to an object’s exact height or position, flag that case for field verification before finalizing the proposal. For solar teams using an integrated workflow such as Enervio, that extra discipline helps keep qualification, estimates, and solar sales conversations aligned with the real site.